RubyConf: Graphics with Ruby
Posted by Nick Sieger Fri, 20 Oct 2006 20:18:00 GMT
Geoff Grosenbach is waxing on pagefuls of numbers condensed into a small, tidy graph that increases the amount of information you can communicate on a page.
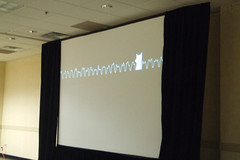
The cartoon fox makes his second appearance of the day in one of Geoff’s sparklines
It is in our hands, the hands of the programmer, to show designers what the range of visual representation capabilities are.
Libraries
- Scruffy -- SVG graphs, no dependencies (i.e., RMagick)
- GNUPlot -- the old standby
- MRPlot -- scientific plots
- PNG -- line and font drawing in pure ruby from Seattle.rb
- Gruff -- depends on RMagick
- Sparklines -- depends on RMagick
- [Ploticus and RRD were mentioned during the talk as well]
Applications
- Automatically generating image mastheads with a font mask, a gradient and a cloud image showing through the mask
- UrbanDrinks.com -- plotting bars on a timeline showing happy hours in Portland
- “Scene graph” -- rendering multiple layers of images/icons on the filesystem into a composite graphics “scene”
- BillMonk.com -- rendered image with multiple components that allows you to circumvent cross-site or crippled javascript issues
- In a Rails controller:
- Generate and cache (with
caches_page) an image with text - Register a new mime type and use
responds_to {|type| type.jpg { ... } }
- Generate and cache (with
- Requisite reference to Edward Tufte
Techniques
- Comparisons -- show two competing trendlines on a graph
- Multivariate analysis -- stockhive.com stock chart rendering
- Content is king -- be judicious
